In the data panel you will see several columns:
- Gene name (symbol)
- Gene ID (see details in Search)
- UniProt ID
- Organism
- Protein name
This information was extracted from the ProteinName field of the FASTA header in the UniProt protein FASTA file (https://www.uniprot.org/help/fasta-headers). - Functional annotations (GO aspects Molecular Function (F) and Biological Process (P))
This information was extracted from GOC (http://geneontology.org/). Annotation supported by experimental evidence is indicated by a yellow flask icon. Annotation propagated from ancestral genes (GO evidence code IBA) is indicated by a green tree glyph. Experimental evidence are:- IDA: direct assay
- IMP: mutant phenotype
- IGI: genetic interaction
- IPI: physical interaction
- IEP: expression pattern
EXP: experimental evidence
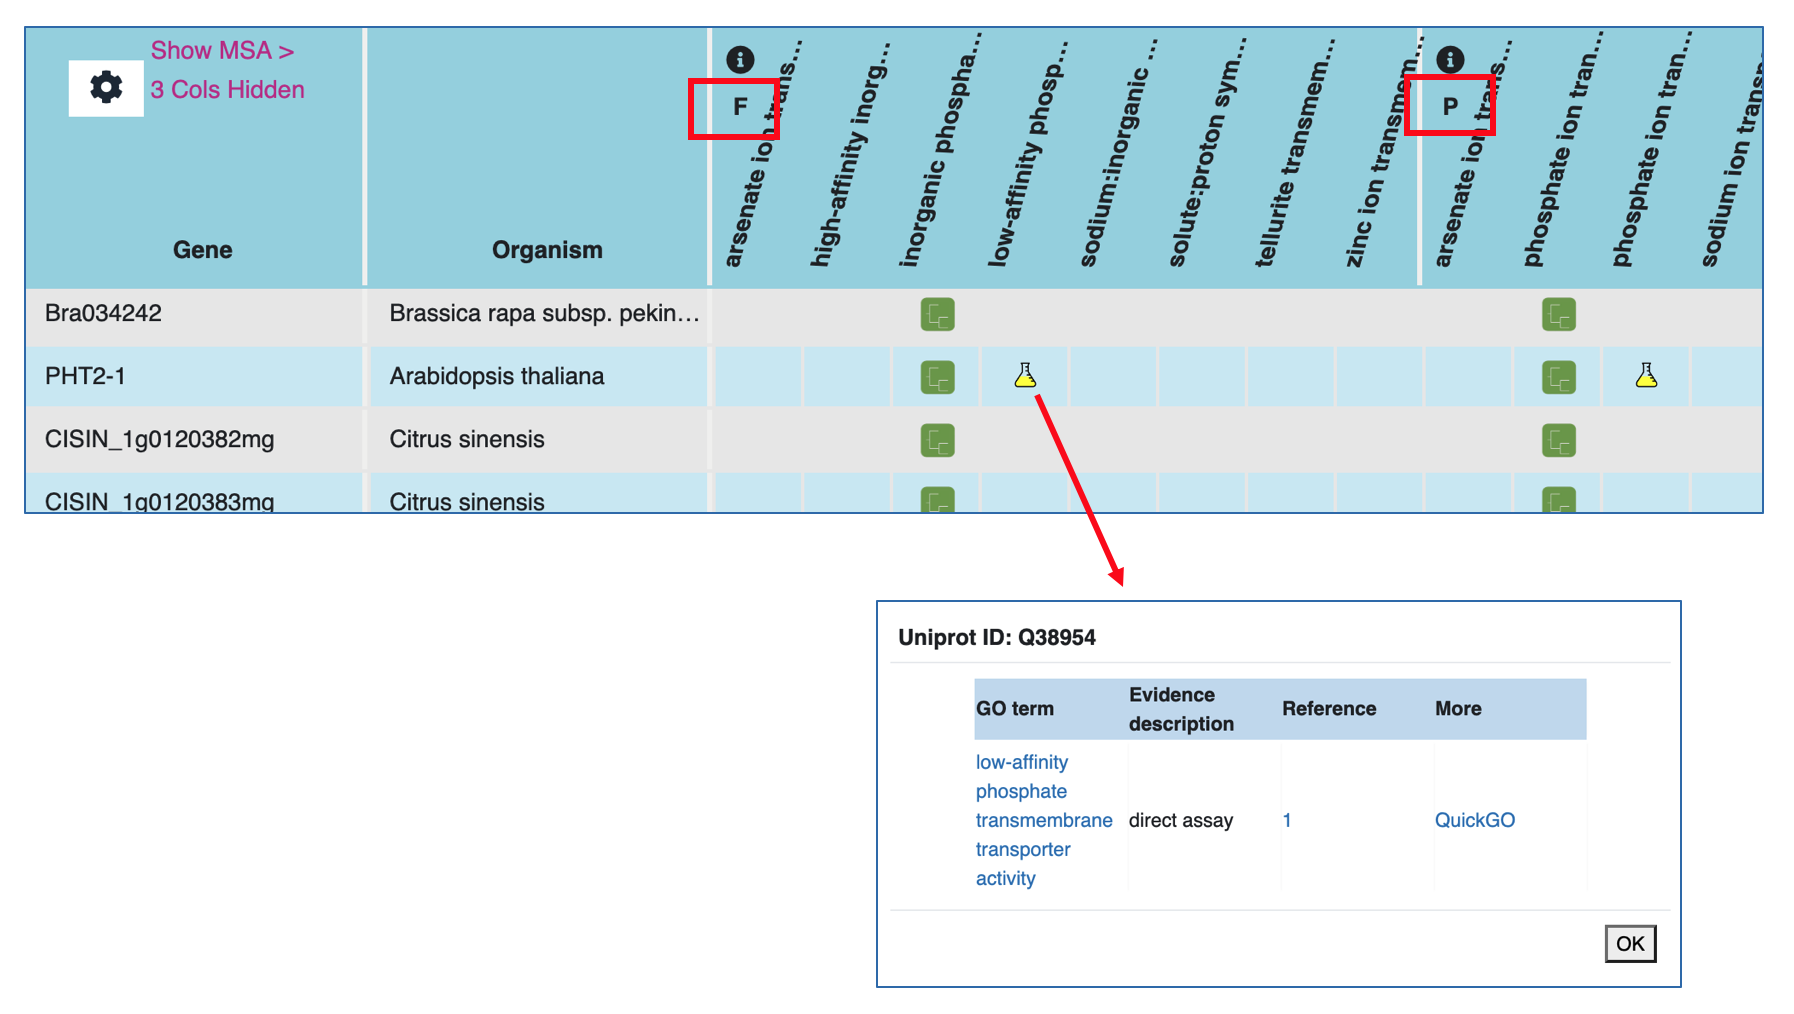
Within the Functional annotations, each listed GO term has annotation to at least one member of the gene family. A yellow flask or a green tree icon in a gene row underneath a GO term indicates the presence of that particular function in that gene supported either by experimental evidence or phylogenetic inference, respectively. Clicking on any of the icons will open a popup window where details about the functional annotation can be found. The columns in the popup include:
- GO term: Shows the GO term name, which is hyperlinked to the term detail page in GOC.
- Evidence description: Shows the type of evidence that supports the annotation of the GO term to the gene/protein.
- Reference: Shows the publication(s) containing the evidence supporting the GO annotation. We use digits (i.e., 1, 2, etc.) to indicate each distinct reference. Each number is a hyperlink to the PubMed record for the article.
- More: Clicking 'QuickGO' takes you to the complete annotation record of the gene (UniProt protein) in QuickGO. You will likely find annotations with other types of evidence, and annotations to cellular components.
- Subfamily name
Subfamilies within each family are groups of genes that share a particularly high degree of similarity due to limited divergence from their common ancestor. Subfamilies are, in general, closely-related orthologs. More about subfamilies
Tips: Only seeing partial text in some data cells? Mouse over the '...', a tool tip will popup in a few seconds with the complete text.
Show/hide and reorder columns in the data panel
Clicking on the configuration icon located at the top left corner of data panel, you will see a popup menu.
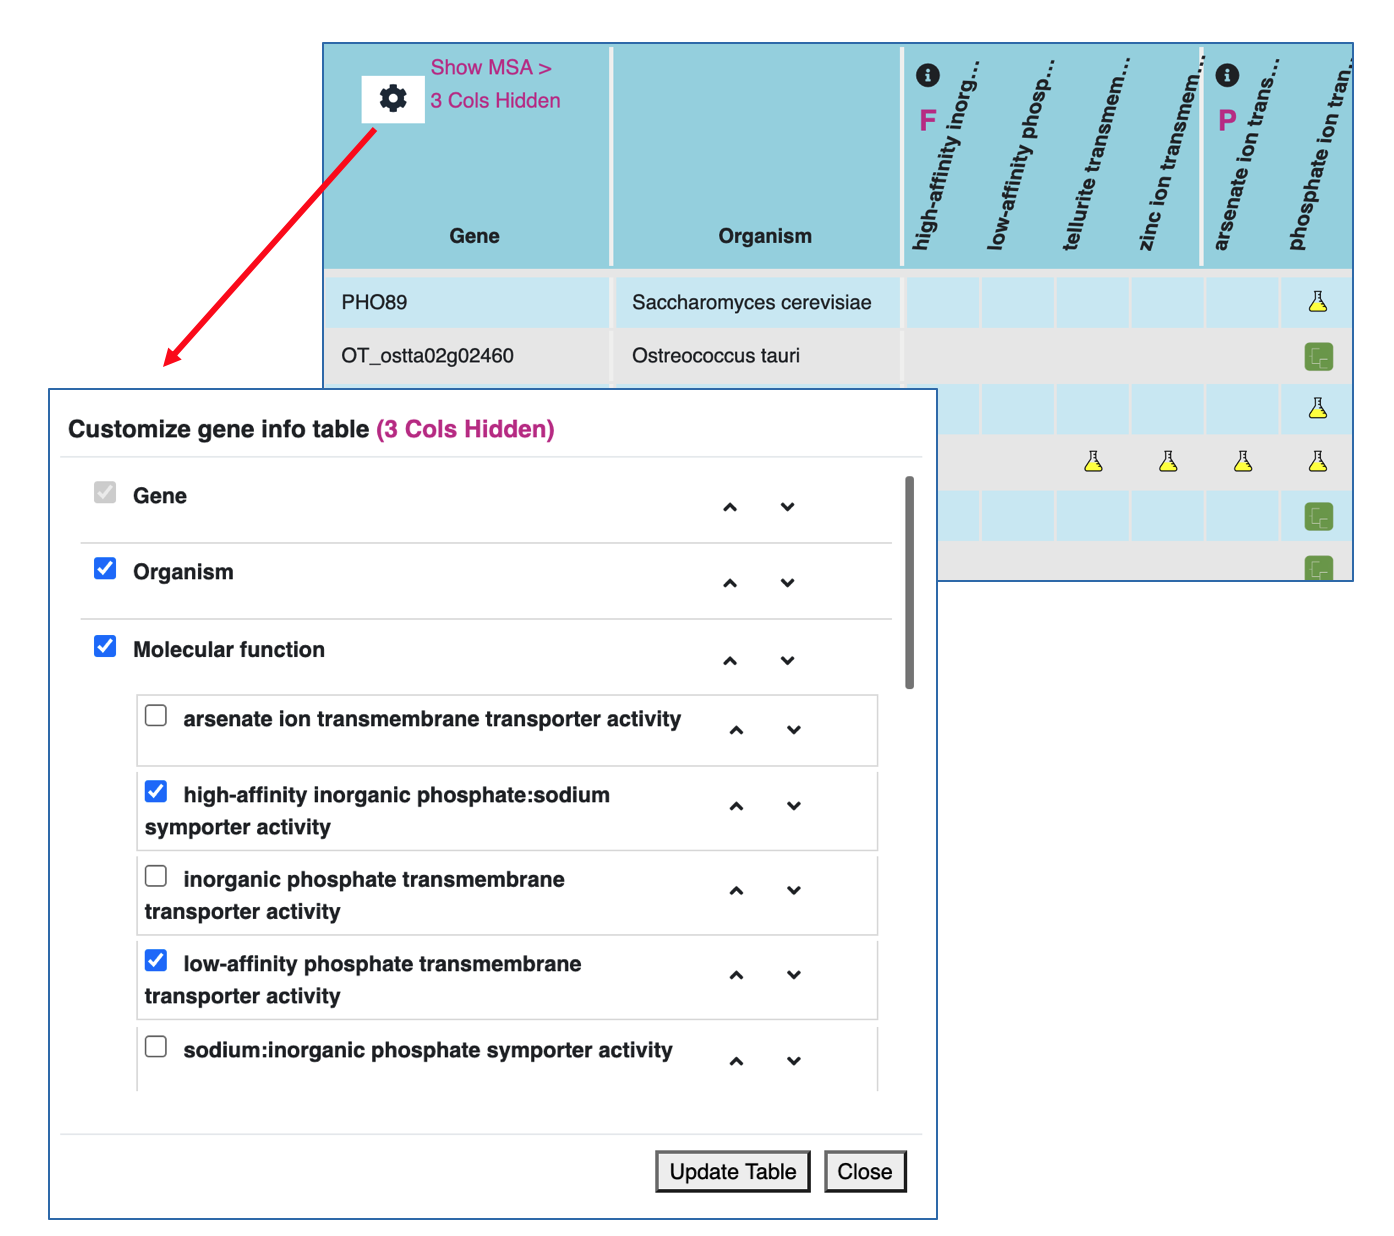
Within the popup configuration menu you can:
- Check or uncheck a particular column or a particular GO term to see or hide it from the data panel.
- Use the up or down arrow to relocate (reorder) columns or GO terms.
Toggle to see the multiple sequence alignment (MSA) of a gene family
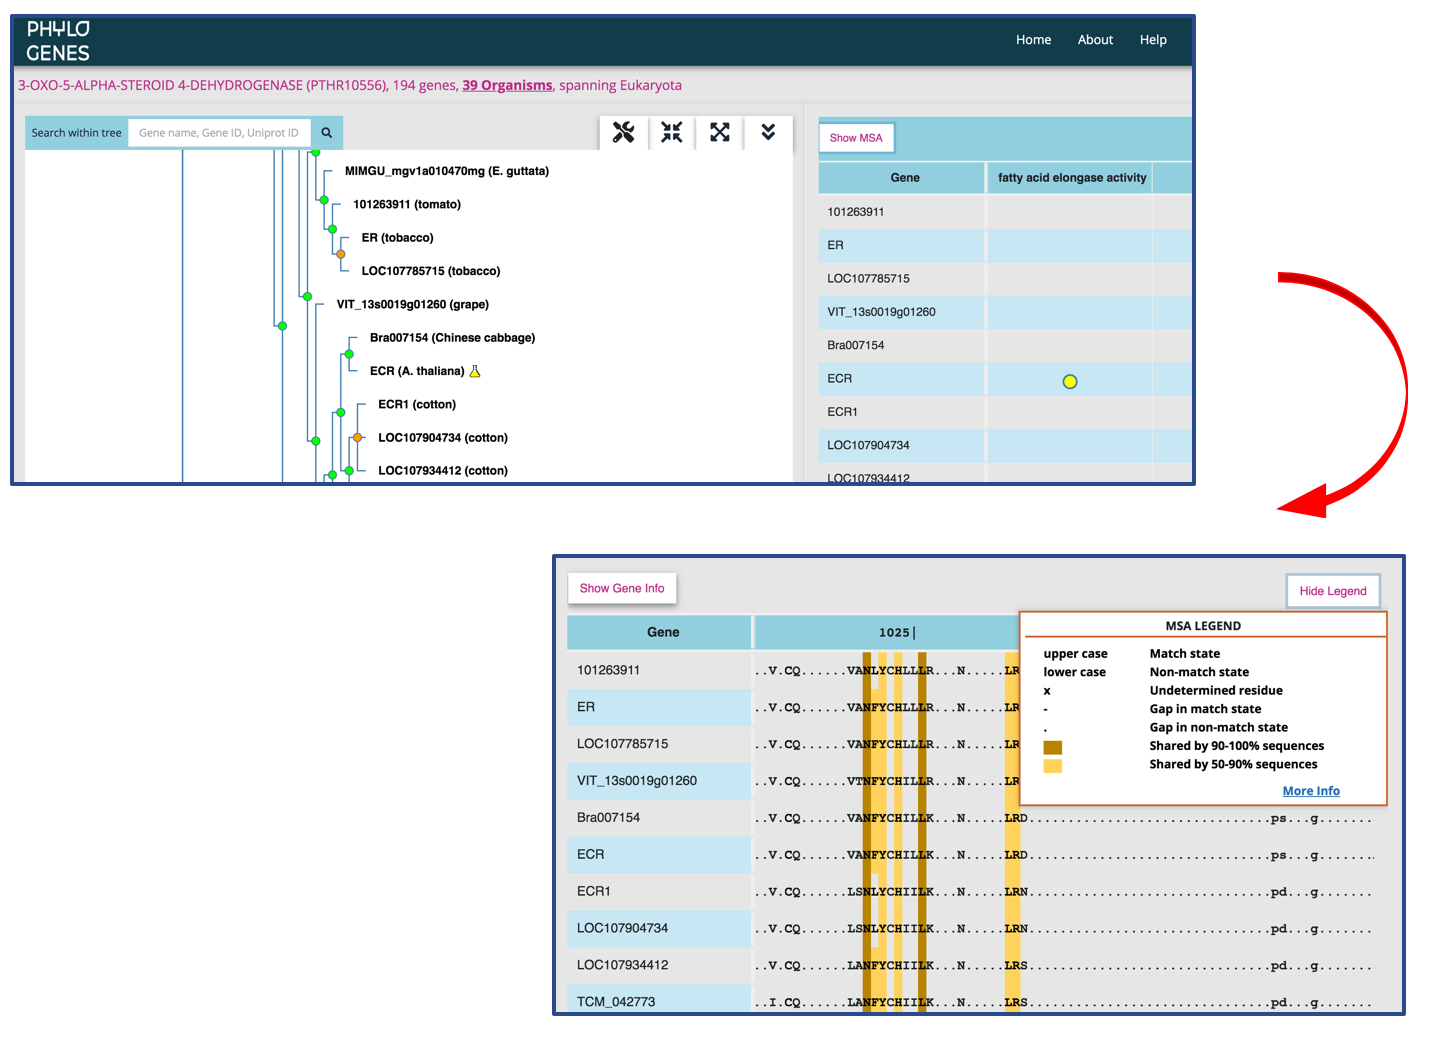
The MSA is built using the MAFFT software and represents an alignment across the entire length of all protein sequences in a PANTHER family (please see here for difference between a PANTHER family and a PhyloGenes family.) The sequence of an internal node is deduced from all of its child nodes, and is shown in the MSA when the child nodes are collapsed in the gene family tree.
- an uppercase letter: the residue is shared by at least 30% of sequences at the same position. It is considered more conserved (aka match state). Only match state residues are used in constructing PANTHER HMMs. When looking at the sequence of an internal node, the uppercase letter X indicates an undetermined ancestral residue.
- a lowercase letter: less conserved amino acid residue (aka non-match state). The lower case letter x represents an undetermined ancestral residue.
- a dash symbol (-): a gap in a match state site
- a dot symbol (.): a gap in a non-match state site
Higher sequence similarities shared among proteins in a PhyloGenes family are indicated with color shadings in MSA.
- a darker shading over an amino acid residue indicates that the residue is shared by 90% or more sequences at the same position.
- a lighter shading indicates a residue shared by more than 50% but less than 90% of sequences.
- the identity is calculated by including all protein sequences in a PhyloGenes family.
- sequence similarity is recalculated when a user chooses to run ‘prune tree by organism’. The pruned protein sequences are excluded in recalculating sequence similarity.
Add Comment